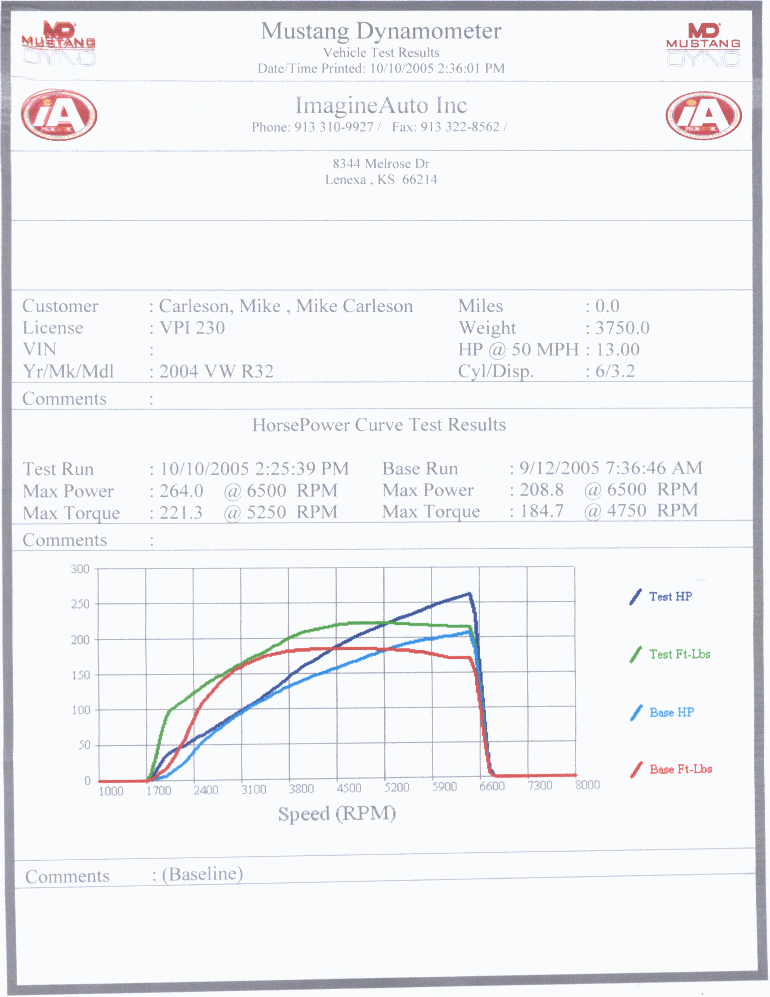

Before and after:

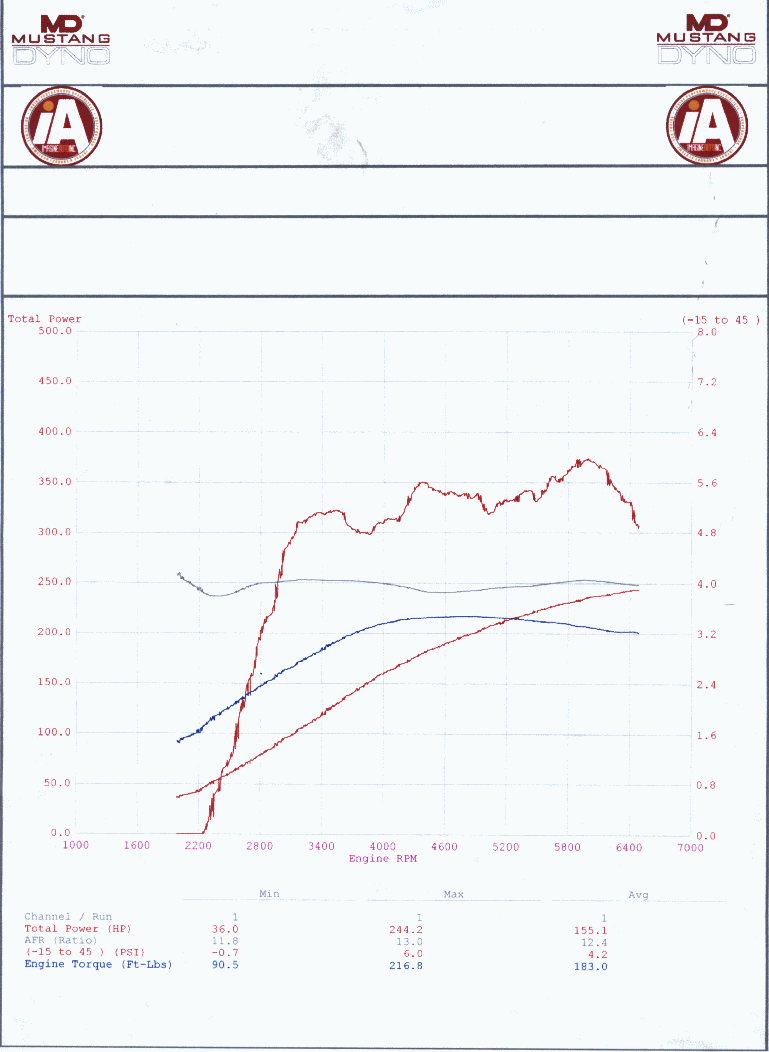
Measurements for HP, AFR, boost, and torque during one of the pulls:

The big red line that has the peaks and valleys is the boost curve. It looks more dramatic than it is, due to the boost being on a 0-8psi scale....the dips look a lot bigger than if they would have used a 0-15psi scale, etc. The numbers on the right side correspond to the boost level. You can see that the last peak ran just about 6psi, and probably averaged around 5psi which was expected. The black line in the center is the AFR, which was running pretty steady at about 12.4, which would be nice to get down to 11.5 or so...it peaked at 13 which is getting pretty lean. Then of course the smaller lines are torque (blue) and hp (red).
Keep in mind the numbers are to all 4 wheels, but
never the less, they are lower than expected. EIP claims they saw 310-315FWHP with
this version of software. Using a 15% drivetrain loss for FWD mode, that translates
into ~365-370HP. Assuming a 20% drivetrain loss for AWD mode and working backwards
from those calculated crank values, we should expect to see ~291-296AWHP.